


Enology Notes #147
Enology Notes #147, January 28th, 2009 - Link to PDF
To: Winemakers and Prospective Winemakers
From: Bruce Zoecklein, Professor and Head, Enology-Grape Chemistry Group, Virginia Tech
Subjects Discussed in Enology Notes #147
- Electronic Nose Application for the Grape and Wine Industry: Research Update
- Winery Sustainability Program Online
- MSU and VT Winery Establishment Conference, February 17-19, 2009.
- Winery Planning, Design and Expansion Workshop
1. Electronic Nose Application for the Grape and Wine Industry: Research Update
A major challenge for the grape and wine industry is to replace time-consuming laboratory analyses, used in process and control quality monitoring, with new application techniques that are fast, precise and accurate. For example, red grape color measurements represent the need for rapid analytical methods that may be used as objective indicators of grape quality, grape ripeness and/or uniformity of ripeness. Substantial progress has been made in this area. Currently, many of the new technologies being developed for component analysis are spectroscopic techniques that operate in the visible (Vis), near infrared (NIR) and mid-infrared (MIR) wavelength regions of the electromagnetic spectrum. Additionally, research in non-invasive testing using fluorescence or photoluminescence, T-rays (Terahertz radiation, or the far-infrared region of the spectrum just beyond microwaves), X-ray and gamma rays for some grape and wine components may prove successful (Smith 2008).
The analysis of grape and wine volatiles represents a significant challenge. Conventional analyses of volatiles are mostly conducted using gas chromatographic (GC), GC mass spectrometry (GC-MS), and GC olfactory (GCO) methods, and involve very expensive equipment, time- and labor-intensive steps, methods development, sample preparation, separation of specific volatile compounds using appropriate chromatographic columns, and chromatogram interpretation.
Electronic nose (Enose) technology represents a possible alternative to volatile measurement, at least in some applications. These are multi-sensor arrays designed to measure head-space volatiles. Each sensor type has a greater or lesser affinity for a particular chemical class or group of compounds. The adsorption of volatiles on the sensor surface causes a physical or chemical change in the sensor, allowing a specific reading for that sample in a unique pattern or “fingerprint” of the volatiles (Mallikarjuanan 2005). Using chemometric techniques and multivariate statistical analysis, it is possible to distinguish among groups of samples, and possibly identify individual sample components. Electronic nose systems are so-named because their methods of operation are analogous to the way the human sense of smell operates, where multiple nerve cells in the olfactory epithelium provide responses so the brain can identify and characterize aromas. Electronic noses have been around for approximately 35 years, but dramatic advances in both sensor technology and information processing systems have occurred in the last few years. Some electronic nose applications include the following:
Table 1: Some Examples of the Use of Electronic Nose Technology in Wine/Grape Studies
Author |
Year |
Type of EN Used |
Study Focus |
DiNatale |
1996 |
MOS |
Wines of different locations |
DiNatale |
1997 |
QMS |
Changes in wine aroma after opening bottle |
Chatonnet & Dubourdieu |
1999 |
MOS |
Oak toasting levels |
Guadarrama |
2001 |
Conducting Polymer |
Spanish wine identification |
McKellar |
2005 |
MOS |
Wine varieties |
Lozano |
2005 |
MOS (tin oxide array) |
White wine classification |
Garcia |
2006 |
MOS (tin oxide) |
Wine discrimination |
Martin |
2008 |
QMB |
Wine discrimination |
Athamneh |
2008 |
Conducting Polymer (Cyranose) |
Grape maturity |
Advantages of Enose-type systems over conventional technologies, such as gas chromatography, are that they are very rapid, usually involve limited sample volume (we have investigated applications using non-destructive analysis of fruit) and are relatively inexpensive. As such, certain types of Enose systems will see increased use by our industry. There are some limitations, however. Each system must be optimized for the particular application, which includes a review of such parameters as pump speeds, volatiles residence time, temperature, etc. Currently, most electronic nose detectors provide little information regarding specific compound concentrations and, therefore, must be compared with standard reference samples provided by GC-MS or compared with conventional sensory evaluation. Additionally, most (but not all) Enose systems cannot quantify specific volatile compounds, but rely on the benefit that a pattern of a mixture of volatiles may be more important than detection of individual components. As such, the strength of many systems has traditionally been in differentiating standard or control patterns of volatiles vs. a deviation from that standard. As such, Enose has been used in the wine industry to monitor toasting homogeneity of oak barrels (Chatonnet and Dubourdieu 1999), and for wine discrimination (Di Natale et al. 1996, Rong et al. 2000, Penza and Cassano 2004, Santos et al. 2004, Ragazzo-Sanchez et al. 2005, García et al. 2006). A new generation of acoustic wave-type sensors, such as the zNose, allows the electronic nose to operate like a miniature GC, and can identify and quantify specific volatile compounds.
Types of Electronic Nose Systems
Electronic noses are comprised of (1) chemical sensors, (2) electronic system controls, and (3) information-processing systems and pattern-recognition software. There are a number of factors that can alter the precision, accuracy, and sensitivity of Enose systems, including sensor drift, temperature alterations, humidity, and ethanol/water vapor concentrations. The Enology-Grape Chemistry Group has used several classes of electronic nose systems that differ mainly in their sensors, including quartz-microbalanced sensors (QMS), conducting polymer sensors, metal oxide sensors (MOS), and surface acoustic wave (SAW)-based sensors. Selectivity, sensitivity, and detection of volatile compounds differ according to the sensor type.
Quartz-Microbalanced Sensors. Quartz-microbalanced sensors (QMS) measure the change in frequency of oscillation for a given volatile compound. QMS are composed of a quartz base with a spray-on, thin polymer coating. Each polymer consists of functional groups that make it selective for various volatile compounds. A molecular interaction between the volatile and the polymer coating occurs as volatile compounds pass through the sensors. The interaction causes a change in mass of the sensor, causing a change in the frequency of oscillation (Schaller et al. 1998), which differentiates one volatile pattern from another.
Conducting Polymers. Sensors are composed of a carbon- or silicone-base polymer substrate attached to conductive polymers and an electrode bridge (Mallikarjunan 2005). Adsorption of volatiles causes the sensors to swell causing a change in electrical potential (Figure 1). The maximum change in resistance between the baseline and sample cycles is recorded and stored to compose a “smell-print” for a given sample. Multiple polymer systems are among of the most selective and sensitive electronic noses (Mallikarjunan 2005).
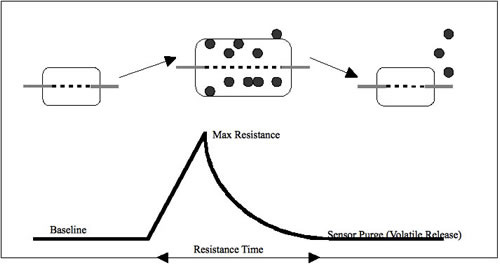
Figure 1: Conducting Polymer Sensor Mechanism
MOS Sensors. Metal oxide sensors (MOS) are composed of a ceramic base coated with metal oxide film. Adsorption of volatiles causes a change in conductance. Reducing compounds cause an increase in conductance, while oxidizing compounds cause a decrease in conductance (Mallikarjuan 2005). MOS-based systems require a high operational temperature (200-600°C) making them least sensitive to water vapor, compared to other electronic nose systems. As such, these systems have been used traditionally in wine evaluations (Di Natale et al. 1996, Chatonnet and Dubourdieu 1999, Santos et al. 2004, Lozano et al. 2005, McKellar 2005, García et al. 2006).
Surface Acoustic Wave Sensors. Surface acoustic wave (SAW)-based sensors, specifically the zNose-type systems, operate as a miniature, fast-reading gas chromatography (GC) column. Samples are injected into a sampling port directly, concentrated, and sent through a column by use of a carrier gas. Volatiles interact with the column’s given polarity like a GC. The detector measures two attributes: identification of the compound through a chromatogram in relation to peak retention time of a given compound, and quantification based on the change in frequency of the quartz crystal sensor. SAW systems differ from others in that they can quantify volatiles.
The Enology-Grape Chemistry Group at Virginia Tech has conducted laboratory and field research evaluating various electronic nose systems and applications. The following is a brief snapshot of several studies undertaken by graduate students in our group: Denise Gardner, Yamuna Devarajan, Amanda Martin, and Ahmad Athamneh. Several of their publications are posted at www.vtwines.info. Click on-line publications. Some of their work electronic nose work in progress has been outlined in previous editions of Enology Notes.
Evaluation of Grape Volatiles Using Electronic Nose Systems
A significant volume of research has advanced our understanding of how various viticultural parameters and practices, including fruit maturity, crop level, crop exposure (Bergqvist et al. 2001, Zoecklein et al. 1998), leaf area to crop ratio (Kliewer and Dokoozlian 2005), shoot density, and training systems (Reynolds and Wardle 1991) affect grape and wine volatile compounds and sensory response. Yet a quick, reliable evaluation tool that can be used to monitor the impact of vineyard management on grape volatiles is lacking.
Each grape variety has a certain spectrum of aroma volatiles in the fruit. Often five to 20 aromas are sufficient to characterize a variety. Major grape volatiles or their precursors are present in the order of 10-6000 ng/kg fresh weight (Allen et al 1995). This is roughly equal to eight berries in a million tons of fruit (Winter 2001). Naturally, such small quantities have significant implications with respect to measurement.
The pool of free aroma volatile components and their precursors increases rapidly in the advanced stage of fruit maturity referred to as engustment (Coombe and McCarthy 1997). For that reason, many winemakers sensorially, but subjectively, evaluate juice aroma and taste grapes as a maturity gauge. Because of the difficulties associated with sensorial evaluation, there is a need for a reliable, simple, and objective technique for evaluation of grape maturity, based on grape volatiles.
Case Study: Grape Maturity Based on Fruit Volatiles (Athamneh et al. 2008)
Grape maturity is a critical attribute impacting potential wine quality. As all winemakers know, maturity evaluation is difficult, due to the many interrelated factors that impact physical and chemical changes, and limitations in the understanding of those factors. Currently, grape maturity evaluation often includes measurements such as sugar content, and primary metabolites such as grape acid level, individually or in combination. These assays may be influenced by sampling method and accuracy, and sample processing variations. Additionally, specific levels of sugar and other primary grape metabolites do not always strongly correlate to potential wine quality.
We evaluated the capacity of a conducting polymer-based electronic nose system to monitor fruit maturity by measuring Cabernet Sauvignon, Merlot and Cabernet franc grape volatiles over three seasons. The electronic nose was optimized as described by Athamneh et al. (2006). Fruit developing on VSP and modified Ballerina were wrapped in polyethylene bags for 45 min, followed by non-destructive electronic nose headspace analysis. During various stages of fruit maturity, results were compared with laboratory electronic nose readings and up to eleven physical and chemical indices used to evaluate fruit maturity (berry weight, pH, Brix, sugar per berry, titratable acidity, total phenols, color intensity, hue, total anthocyanins, and two groups of aroma/flavor precursors). Data were evaluated using canonical distributions, a statistical representation for looking at linear combinations of variables and separating them in two- or three-dimensional space. Canonical distribution demonstrated that separation based on volatile profiles using the electronic nose was greater than the separation provided by the physicochemical analyses, taken either individually or collectively (Figure 2).
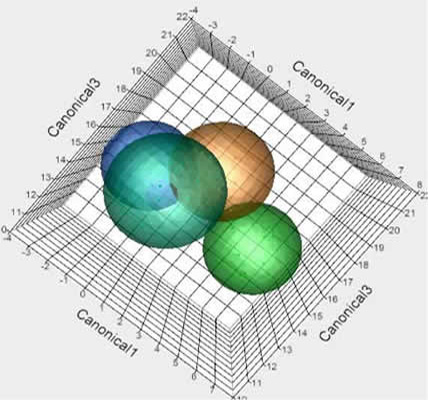
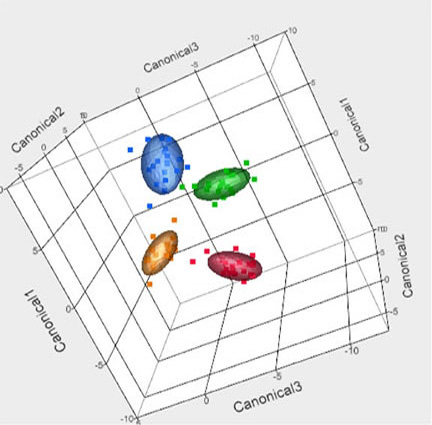
Figure 2. Canonical distribution of 11 physicochemical indices (top) and Enose (bottom) monitoring of Cabernet franc maturity over a four-week period. Note the overlapping and greater dispersion in the physical-chemical data.
Case Study: Effects of Grapevine Canopy Side on Fruit Volatiles (Denise Gardner, Yamuna Devarajan work in progress)
Fruit on different sides of the grapevine canopy may vary in maturity due to variations in sunlight exposure and heat, among other factors (Smart and Robinson 1991, Downey et al. 2006). In this study, VSP-trained north-south running vineyard rows were evaluated by comparing fruit from the east vs. west side of the canopy from véraison to harvest. Traditional Cabernet franc grape maturity indices described above did not differ statistically based on canopy side at harvest for two seasons. However, a conducting polymer-based electronic nose was able to differentiate between samples from east vs. west, based upon fruit volatiles using non-destructive measurements from clusters on the vine.
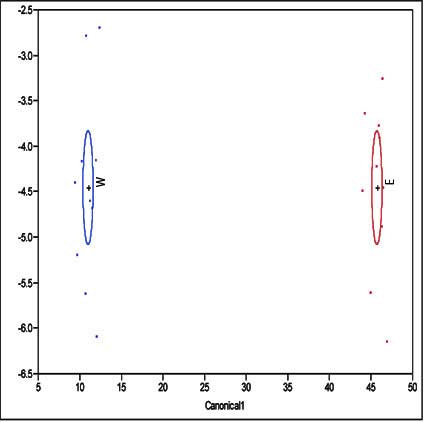
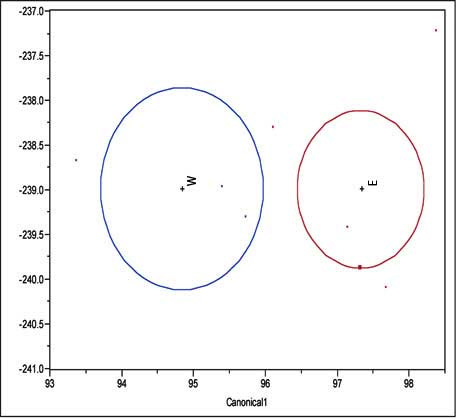
Figure 3. Canonical distributions of electronic nose data (top) and physicochemical indices (bottom) in canopy side differences (W = west, E = east) for two seasons. Note the greater degree of separation and tighter clustering of the electronic nose results.
The canonical plots (Figure 3) illustrating differences between canopy sides also illustrate seasonal variations. Season 1 was characterized by a greater degree of ripening uniformity based on the standard deviation of all chemical and physical data vs. season number 2. Comparison of the electronic nose with conventional GC/MS analysis has confirmed these differences.
Case Study: Effects of Training Systems on Wine Volatiles (Zoecklein et al. 2008)
In many regions, vines often produce more vegetation than is optimal for sunlight interception with conventional training systems, such as VSP. Management of excessive vigor may include summer pruning, conversion to divided canopy training systems, or application of multiple strategies to help balance vegetative and reproductive growth. Canopy division offers a means to reduce the frequency of summer pruning, and can translate to increased crop yields and increased sun exposure. Sunlight exposure of fruit is profoundly affected by training system, and fruit exposure has a direct impact on the concentration of grape aroma/flavor precursors (Zoecklein et al. 1998, 2000). The potential yield increase with divided canopy is attractive, however, growers and winemakers are concerned with the potential for over-cropping and negatively impacting wine quality. We have conducted studies evaluating the impact of Vertical Shoot Positioned (VSP), Smart-Dyson (SD), and Geneva Double Curtain (GDC) training systems on grape and wine volatiles. The following discussion is on Viognier.
Fruit from both studies was harvested at similar Brix values, with differences in berry weight, pH, titratable acidity, and malic and tartaric acids among treatments generally not significant. Principal component analysis of Viognier wine (Figure 4) showed that descriptors appeared to cluster around growing season. For example, wines produced in the cool, wet, 2003 vintage, with limited fruit Brix, were generally characterized by vegetative aromas, while those produced in the drier and warmer 2004 vintage had higher fruit and overall aroma intensity.
Triangle difference sensory testing could not consistently distinguish among wines for vineyard treatments each season. Canonical projection plot separations of volatile compounds in the Viognier wines were determined by electronic nose measurements after bottle aging (Figure 5). The ethanol concentration of wines in this study did not differ.
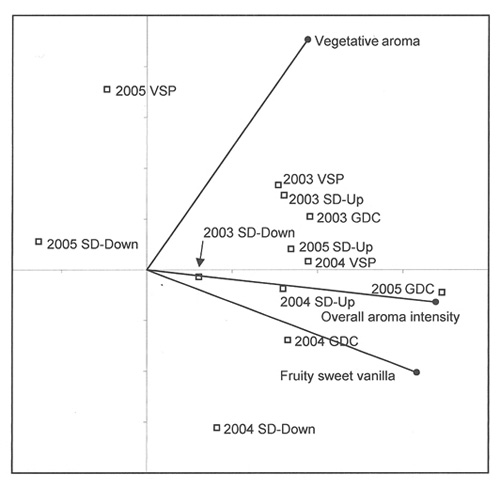
Figure 4. Principal component analysis (PCA) of aroma of Viognier wines produced on Geneva Double Curtain (GDC), Smart-Dyson (SD) Down or Up, and Vertical Shoot Positioned (VSP) training in 2003 through 2005.
The 2004 bottle-aged GDC, VSP and SD wines were clearly separated (circles do not overlap) based on volatile compounds. SD-Up and SD-Down were similar in the aroma profile as indicated by the overlapping circles.
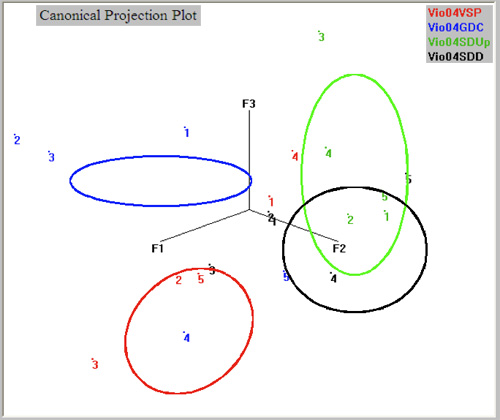
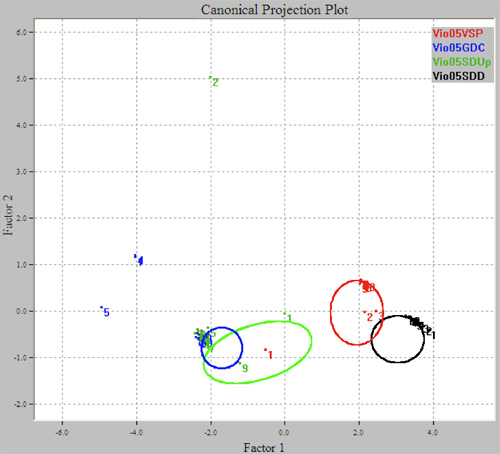
Figure 5. Canonical projection plots of Viognier wines produced on Geneva Double Curtain (GDC), Smart-Dyson (SD) Down or Up, and Vertical Shoot Positioned (VSP) training in 2004 (top) and 2005 (bottom).
Cabernet franc wines produced from different training systems were also evaluated. Principal component sensory analysis indicated clear separation of treatment wines based upon aroma (Figure 6). The SD-Up wines were characterized by overall aroma intensity, SD-Down by diacetyl/vanilla and red fruit, while the VSP and GDC were separated based on vegetal and smoke/wood aromas on season.
Figure 6. Principal component analysis (PCA) of aroma of Cabernet franc wines produced on Geneva Double Curtain (GDC), Smart-Dyson (SD) Down or Up, and Vertical Shoot Positioned (VSP) training for one season.
Sensory analyses of Cabernet franc wines were compared to electronic nose evaluations. Bottled-aged wines showed some overlap in the volatiles (Figure 7). The Enose results reflect some parallel with the overall sensory differences noted in the principal component analysis.
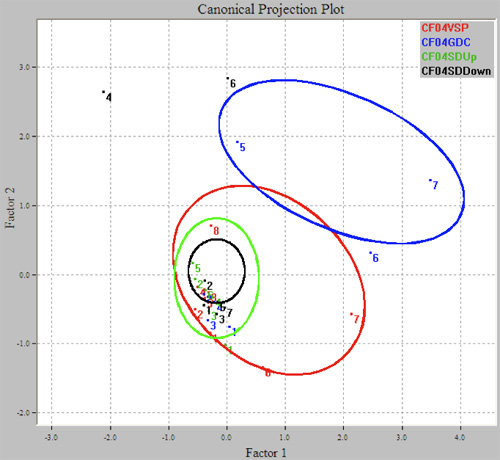
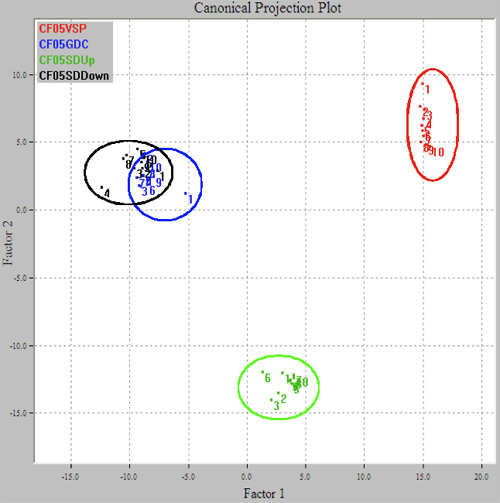
Figure 7. Canonical projection plots of Cabernet franc wines produced on Geneva Double Curtain (GDC), Smart-Dyson (SD) Down or Up, and Vertical Shoot Positioned (VSP) training for two seasons.
Case Study: Electronic Discrimination of Cabernet Sauvignon Wines from Grapes Treated with Aqueous Ethanol Post-Bloom (Martin et al. 2008).
Research has suggested that aqueous ethanol vapor can increase the anthocyanin concentration and ripening in tomatoes and cranberries, respectively (Farag et al. 1992, Beauleiu and Saltveit 1997). It has also been reported that ethanol increased the anthocyanin content in berry skins (El Kereamy et al. 2002). Our studies have confirmed these results in grapes.
In a study conducted by the Enology-Grape Chemistry Group at Virginia Tech, aqueous ethanol was sprayed on grape clusters 13 weeks post-bloom in concentrations of 0, 5% or 10% v/v. Fruit from each treatment was harvested at the same Brix level. Chemical analyses (pH, titratable acidity, total and phenol-free glycoside concentration, color hue, color intensity, and total anthocyanins) collectively were able to accurately discriminate among wines produced from each treatment. Triangle difference sensory analysis testing of aroma by a consumer panel was not able to differentiate among treatments. However, a trained winemaker panel was able to differentiate wines. In this study we evaluated the use of an MOS electronic nose system. It was able to accurately identify the control group and the 5% ethanol spray treatment 90% of the time (Figure 8).
Conclusion
Electronic nose technology has potential as both a vineyard and winery monitoring tool. Each type of electronic nose has different sensor systems that have different detection limits for particular types of components. Naturally, compounds in the highest concentrations are more easily measured. Despite some limitations, electronic nose technology has a potential as both a vineyard and winery monitoring tool. Additional information on our electronic nose research has been reported in previous editions of Enology Notes available at www.vtwines.info. Click Enology Notes Index.
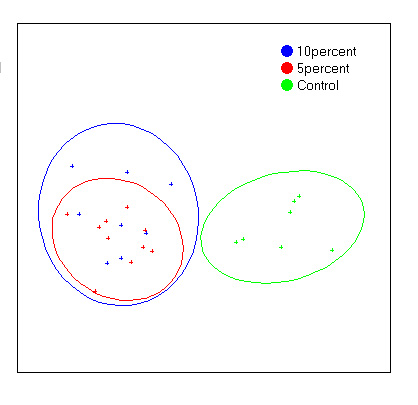
Figure 8. Projection plot of control, 5% and 10% ethanol spray treatments post-bloom of Cabernet Sauvignon wines from the discriminate analysis of MOS electronic nose.
References
Allen, M.S., M.J. Lacey, and S.J. Boyd. 1995. Methoxypyrazines of grapes and wines - differences of origin and behavior. Proc. 9th Austr. Wine Ind. Tech. Conference.
Athamneh, A., K. Mallikarjunan, and B. Zoecklein. 2006. Optimization of system and experimental parameters of an electronic nose system for the detection of wine-grape aroma. In: Proceedings of the Institute of Food Technology Annual Meeting, Orlando, FL.
Athamneh, A., B. Zoecklein and K. Mallikarjunan. 2008. Electronic nose evaluation of Cabernet Sauvignon fruit maturity. J. Wine Res. Vol. 19:67-78.
Beauleiu, J.C. and M.E. Saltveit 1997. Inhibition or promotion of tomato fruit ripening by acetaldyde and ethanol is concentration dependant and varies with fruit maturity. J. Am. Hort. Sci. 122:392-8.
Bergqvist, J., N. Dokoozlian, and N. Ebisuda. 2001. Sunlight exposure and temperature effects on berry growth and composition of Cabernet Sauvignon and Grenache in the central San Joaquin Valley of California. Am. J. Enol. Vitic. 52:1-7.
Chatonnet, P. and D. Dubourdieu. 1999. Using electronic odor sensors to discriminate among oak barrel toasting levels. J. Agric. Food Chem. 47:4319-4322.
Coombe, B.G. and , M.G McCarthy. 1997 Identification and naming of the inception of aroma development in ripening grape berries. Aust. J. Grape Wine Res., 3:18-20.
DiNatale C.D., Macagnano A, Davide F, D'Amico A, Paolesse R, Boschi T, Faccio M, Ferri G. 1997. An electronic nose of food analysis. Sensors and Actuators B: Chemical 44:521-6.
Di Natale, C., F.A.M Davide, A. D'Amico, P. Nelli, S. Groppelli, and G. Sberveglieri. 1996. An electronic nose for the recognition of the vineyard of a red wine. Sensors and Actuators B: Chemical 33:83-88.
Downey, M.O., N.K. Dokoozlian, and M.P. Krstic. 2006. Cultural practice and environmental impacts on the flavonoid composition of grapes and wine: A review of recent research. Am. J. Enol. & Vitic. 57:257-268.
El Kereamy A, C. Chervin, J-M Souquet, M. Moutounet, M-C Monje, F. Nepveu, H. Mondies, CM Ford, R. van Heeswijck, J-P Roustan. 2002. Ethanol triggers grape gene expression leading to anthocyanin accumulation during berry ripening. Plant Science 163:449-54.
Farag, K.M., J.P. Palta, and E.J. Strang. 1992. Ethanol enhances the effectiveness of ethaphon on anthocyanin production in cranberry fruit. J. Am. Soc. Hort. Sci. 122:392-8.
García, M., M. Aleixandre, J. Gutiérrez, J. and M.C. Horrillo. 2006. Electronic nose for wine discrimination. Sensors and Actuators B: Chemical 113:911-916.
Guadarrama A, Fernandez JA, Iniguez M, Souto J, de Saja JA. 2001. Discrimination of wine aroma using an array of conducting polymer sensors in conjunction with solid-phase micro-extraction (SPME) technique. Sensors and Actuators B: Chemical 77:401-8.
Kliewer, W.M., and N.K. Dokoozlian. 2005. Leaf area/crop weight ratios of grapevines: Influence on fruit composition and wine quality. Am. J. Enol. Vitic. 56:170-181.
Lozano, J., J.P. Santos and M.C. Horrello. 2005. Classification of white wine aroma with electronic nose. Talanta. 67(3): 610-6.
Martin, A., K. Mallikarjunan, and B.W. Zoecklein. 2008. Discrimination of wine produced from Cabernet Sauvignon grapes treated with ethanol post-bloom using electronic nose. Int. J. Food Eng Vol. 4:14.
Mallikarjunan, K.P. 2005. Electronic nose applications in the food industry. In Nondestructive Testing of Food Quality (J. Irudayaraj and C. Reh, eds.), pp. 237-284. Wiley-Blackwell, Ames, Iowa.
McKellar, R.C., H.P.V. Rupasinghe, X. Lu, and K.P. Knight. 2005. The Electronic Nose as a Tool for the Classification of Fruit and Grape Wines from Different Ontario Wineries. J. Sci. Food Agric. 85:2391-2396.
Penza, M., and G. Cassano. 2004. Recognition of adulteration of Italian wines by thin-film multisensor array and artificial neural networks. Analyt. Chim. Acta, 509:159-177.
Ragazzo-Sanchez, J.A., P. Chalier, and C. Ghommidh. 2005. Coupling gas chromatography and electronic nose for dehydration and desalcoholization of alcoholized beverages: Application to off-flavour detection in wine. Sensors and Actuators B: Chemical, 106, 253-257.
Reynolds, A.G., and D.A. Wardle. 1991. Impact of training system, vine spacing, and basal leaf removal on the performance of Riesling wines. Am. Soc. Enol. Vitic. Tech. Abstr. 42:27.
Rong, L., W. Ping, and H. Wenlei. 2000. A novel method for wine analysis based on sensor fusion technique. Sensors and Actuators B: Chemical, 66, 246-250.
Santos, J.P., T. Arroyo, M. Aleixandre, J. Lozano, I. Sayago,M. García, M.J. Fernández, L. Arés, J. Gutiérrez, J.M. Cabellos, M. Gil, and M.C. Horrillo. 2004. A comparative study of sensor array and GC-MS: application to Madrid wines characterization. Sensors and Actuators B: Chemical, 102:299-307.
Schaller, E., J.O. Bosset, and F. Escher. 1998. "Electronic noses" and their application to food. Lebensmittel-Wissenschaft und Technologie, 31, 305-316.
Smart, R. and M. Robinson. 1991. Sunlight into Wine. Adelaide, South Australia: Winetitles.
Smith, F. 2008. Non-invasive testing sets the scene. Aust. New Zealand Grapegrower & Winemaker. July,
Winter, E. 2001. Research to practice winegrape quality management. CRCV Publications.
Zoecklein, B.W., T.K. Wolf, S.E. Duncan, J.E. Marcy, and Y. Jasinski. 1998. Effect of fruit zone leaf removal on total glycoconjugates and conjugate fraction concentration of Riesling and Chardonnay (Vitis vinifera L.) grapes. Am. J. Enol. Vitic. 49:259-265.
Zoecklein, B.W., L.S. Douglas, and Y.W. Jasinski. 2000. Evaluation of the phenol free glycosyl-glucose determination. Am. J. Enol. Vitic. 51:420-423.
Zoecklein, B.W., T.K. Wolf, L. Pélanne, M.K. Miller and S.S. Birkenmaier. 2008. Effect of vertical shoot-positioned, Smart-Dyson and Geneva Double-Curtain training systems on Viognier grape and wine components. Am. J. Enol. Vitic. 59:11-21.
2. Winery Sustainability Program Online. In early 2008, we organized a very successful Winery Sustainability and Design program covering many winery sustainability issues. Because of the success of this event and the importance of the subject, I have posted an Adobe Presenter version of this online. The subjects included in these audio and PowerPoint slide presentations are as follows:
-
Sustainability in Winery Design
-
Sustainable Winery Architecture
-
Why Solar, Why Now
-
Gravity Flow Design, Principles and Practices
-
Cellars, Caves and Earth-Sheltered Design
-
Winery Construction and Sustainable Building Materials
Each presentation is approximately 45 minutes long. Topics are discussed by some of the most respected winery architects, engineers, and winery planners from California and the Pacific Northwest.
This password-protected program is available for a donation of $45 to the Enology-Grape Chemistry Group at Virginia Tech. These funds will be used to support graduate student education.
To gain unlimited access:
-
Mail a check for $45, payable to Virginia Tech Foundation.
-
Send to Terry Rakestraw, Department of Food Science and Technology (0418), Virginia Tech, Blacksburg, VA 24061.
-
Provide your full name and email address.
A password will be emailed to allow full access to all Adobe Presenter programs listed above.
3. MSU and VT Winery Establishment Conference, February 17-19, 2009. Wine is a growing part of American culture. With that interest has come the increase in growing fine wine grapes in non-traditional areas. This three-day conference will cover a host of topics including:
-
The legal and regulatory process
-
The business aspects of wineries
-
Equipping a winery
-
Start-up procedures for wineries
-
Winery quality control and sanitation
-
Market factors for the sale of wine
For more information, download the pdf from http://grapes.msu.edu/pdf/wineryEstablish09.pdf.
4. Winery Planning, Design and Expansion Workshop. A one-day program titled: "Winery Planning, Design and Expansion" is scheduled for March 13, 2009 in King of Prussia PA, just outside of Philadelphia. This event is associated with Wineries Unlimited 2009.
The following topic areas will be reviewed and discussed by leading winery personnel and planners.
Winery Design
-
Winery Facility Design Concepts
-
Winery Design Considerations
-
Winery Layout
Examples of Winery Designs
-
Winery Architecture
-
Winery Designs and Case Studies
Integration of Winery Process Equipment, Layout and Design
-
Stylistic Winemaking and Winery Design
-
Equipment Considerations Overview
-
Equipping Small vs. Large Wineries
-
Fermentation and Storage Vessel Considerations
Sustainable Winery Design Considerations
-
Winery Sustainability Options
-
Wine Caves
-
Gravity Flow Winery Designs
Winery Business Planning
Winery Economics
Registration information is available at www.wineriesunlimited.com.
![]()
Subscription to Enology Notes. All past Enology Notes newsjournals are posted on the Enology-Grape Chemistry Group's web site at: http://www.vtwines.info/.
To be added to (or removed from) the Enology Notes listserve send an email message to with the word "ADD" or "REMOVE" in the subject line.
Dr. Bruce
Zoecklein
Professor and Enology Specialist Head Enology-Grape Chemistry Group
Department of Food Science and Technology, Virginia Tech
Blacksburg VA 24061
Enology-Grape Chemistry Group Web address: http://www.vtwines.info/
Phone: (540) 231-5325
Fax: (540) 231-9293
Cell phone: 540-998-9025
Email: