 VINTNER'S CORNER
Vol.15, No. 5 September - October, 2000
Bruce W. Zoecklein
Department of Food Science and Technology
VPI & SU - 0418
Blacksburg, VA 24061, E-mail: bzoeckle@vt.edu
www.fst.vt.edu/Zoecklein
Table of Contents
I. Yield and Quality 1
II. Web Site 5
III. Vintner's E-mail Communications 5
I. Yield and Quality
For several years Dr. Tony Wolf and I have conducted a study evaluating the influence of crop load on wine quality. The following is from a presentation that I gave at the Technical Conference of the Virginia Vineyards Association in August 2000.
One important question that we are attempting to answer is how are vineyard yields and wine quality related. The assumption that they are inversely related is deeply ingrained and yet the question of yield vs quality must be one of the most important issues for the entire global wine community. Cropping level and wine quality have a complex relationship due to many of the interactions listed in Table 1 and lead to the question, "What creates wine quality?"
Most of us know that significant over or under-cropping can influence wine quality. However, where is the break point at which additional crop will negatively impact quality? That is the practical question. As you know, if we crop vines too heavily the crop load can delay the rate of fruit maturity.
Table 2 illustrates that delay. Chardonnay vines grown on an open lyre system in Winchester were cropped at three levels and harvested on one date. Different letters across indicated significant differences. All other factors equal, this is what you
would expect. The lowest cropped vines mature the most rapidly in terms of degrees Brix. At a set harvest date the Brix values are different and follow the logical expected pattern. The pH is about the same among treatments while TA, sugar per berry, total phenols (TPHE), flavonoid phenols (TFLAV) and total glycosides (Total Gly) are higher in the low-cropped, more mature fruit. The total glycoside concentration is an estimation of the total pool of secondary metabolites, some of which are important aroma/flavor precursors. This data is expressed on a gram per fresh fruit weight basis to account for any variation in berry size.
Table 1. Yield and Wine Quality
Growing season
Vineyard site
Vine density
Clone
Variety
Pruning
Crop thinning and timing
Fruit weight/exposed leaf area
Solar exposure of the fruit
Interrelationships of the above + others
Wine quality, as you might guess, would be different from these three crop levels, and indeed it was. Evaluators could easily differentiate wines produced from the three crop levels. The real question, however, is, "If we simply allow the high crop level grapes to stay on the vine long enough to reach 23.5 degrees Brix will the wine quality be the same, better than or lower than that from the low crop level?" In other words, does crop level simply delay maturity or are there qualitative effects on grape components and subsequent wine quality?
Table 2. Effects of Crop Levels on Chardonnay Grape Chemistry at One Harvest Date
| Harvest Date | 9/21 | 9/21 | 9/21 |
| Treatment | L (3.7 TPA) | M (7.3 TPA) | H (10.2 TPA) |
| Brix | 23.2 a | 22.1 b | 20.8 c |
| pH | 3.75 a | 3.73 a | 3.76 a |
| TA (G/L) | 5.5 ab | 5.4 b | 5.7 a |
| Sugar/berry | 35.9 a | 35.6 a | 32.4 b |
| TPHE (AU) | 7.0 a | 5.7 b | 4.9 c |
| TFLAV (AU) | 4.1 a | 3.5 b | 2.5 c |
| Total Gly/g |
2.1 a | 1.5 b | 1.6 b |
Different letters indicate significant differences at P0.05.
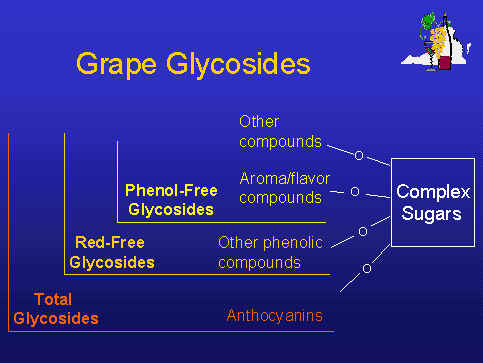
To help to answer these questions we have produced and evaluated wines from different crop levels harvested at the same target Brix values. We have also measured glycosides, important secondary grape metabolites. These secondary metabolites are responsible for wine color, aroma, flavor and structure. They represent, in part, the pool of potential aroma/flavor compounds. The Enology-Grape Chemistry Group has been evaluating methods for separation of various types of grape glycosides. Glycoside fractions are depicted in Figure 1. Total glycosides measure the entire pool of secondary metabolites. The quantification of red-free glycosides estimates the concentration of all glycosides with the anthocyanin or pigmented glycosides removed. This is a useful measure when the effects of color must be eliminated. Our group has been evaluating a phenol-free glycoside measure which we believe provides a truer estimation of aroma/flavor across a broad degrees Brix range. Research suggests that the total glycoside concentration is positively correlated to wine quality at high degrees Brix levels (greater than 21.5), while phenol-free glycoside concentration seems to be positively correlated to wine quality over a broader degrees Brix range. Much of our research effort has been on methods of separating types of these compounds. There is a positive correlation between the concentration of total glycosides and wine quality at high Brix levels. We believe such measurements may allow us to model the relationships between crop level and quality.
Figure 1
FIGURE 1
If we look again at Table 2 and the glycoside content it can be noted that it is significantly higher in the low cropped vines. If the total glycoside concentration is positively correlated to wine quality, one would expect that if the high crop vines are to produce wine of equal quality to the low crop then the concentration of total glycosides in the high crop should eventually equal that of the low crop vines. Again the question remains, will the high cropped vines produce the same wine quality if we simply hang the fruit longer? The answer seems to be related to the length of time required to reach a targeted Brix value. The longer it takes for the degrees Brix to catch up the less likely it is that the glycoside concentration will catch up and wine quality will be equal.
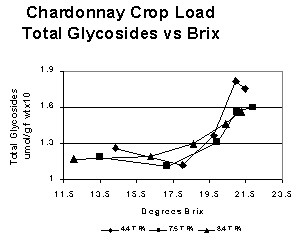
FIGURE 2
Figure 2 shows some data from another imposed crop level treatment, again on Chardonnay grown on an open lyre system in Winchester. Crop levels were equivalent to 4.4, 7.5 and 8.4 tons per acre. This illustrates the change in degrees Brix plotted against total glycoside per gram of fresh fruit weight to account for differences in berry size. This slide is typical of what we have observed.
There are several things to note from Figure 2. At relatively low Brix values (below 19.5) there is not much difference in the glycoside concentration among these three crop level treatments. As previously stated, glycosides are measured on a fresh fruit weight basis to eliminate variations resulting from differences in berry weight. Sensory studies confirmed that there is no difference in the varietal aroma attributes from wines produced from this fruit.
Figure 2
Additionally, within a relatively narrow Brix range (19.5- 21.5) there is a substantial increase in the concentration of glycosides. We call this increase engustment and it is accompanied by substantial increases in the varietal aroma/flavor of the fruit and subsequent wine. This data provides additional justification for the belief that Brix alone, particularly in a warm climate such as Virginia, may not be a completely reliable measure of potential wine quality.
Table 3 shows some of the data from Figure 2 at harvest. In this case, fruit from the three crop level treatments was harvested at a targeted Brix of 21 rather than at a set date. I have removed the mid-level treatment to simplify the table. As can be noted, the high crop level reached the target Brix 14 days after the low crop. If we look at the fruit chemistry it doesn't appear to be dramatically different. But there are slight differences in the total glycoside content. No differences in the phenol-free glycosides were noted. As stated, we believe phenol-free glycosides are a better predictor of potential wine quality at lower Brix values.
Table 3. Effects of Crop Levels on Chardonnay Grape Chemistry at Two Different Harvest Dates
| Harvest Date | 9/26 | 10/10 |
| Treatment | L (4.4 TPA) | H (8.4 TPA) |
| Brix | 21.0 a | 21.2 a |
| pH | 3.41 a | 3.34 a |
| TA (G/L) | 7.4 a | 7.2 a |
| Sugar/berry | 37.5 a | 36.6 b |
| TPHE (AU) | 6.1 a | 5.6 b |
| CAE (mg/L) | 46.6 a | 37.2 b |
| TFLAV (AU) | 3.3 a | 3.4 b |
| Total Gly/g |
1.8 a | 1.6 b |
| 0.9 a | 1.0 a |
Different letters indicate significant difference at P0.05.
How about the wine quality? Table 4 shows the results of duo-trio difference testing on wines produced from the fruit of Table 3. Three glasses are presented to evaluators, two the same and one different. They are asked if they could determine which was the different wine. The numbers listed are the correct responses of the total responses. As Table 4 indicates, the judges could not distinguish between aromas of wines produced from these three crop level treatments. Were the glycoside concentration differences great enough to make a sensory difference, particularly in varietal aromas in the wine? No, not if our target Brix was 21. However, what happens if we raise our target degrees Brix?
Table 4. Effect of Duo-Trio Differences Tests on Chardonnay Wines
| Comparison | Aroma | Significance |
| L vs M | 14/28 | NS |
| M vs H | 15/28 | NS |
| L vs H | 17/28 | NS |
NS = not significant at P0.05.
Figure 3 shows a regression model from the same study which demonstrates the change in glycoside concentration on a fresh fruit weight basis plotted against degrees Brix. At relatively low Brix values (as noted in Table 3) the differences in grape glycoside concentration among treatments are minimal, as are wine quality differences. However, as we move to higher Brix values the differences in the total glycoside content becomes greater, as do the differences in the aromas/flavor of the wines produced from these treatments.
If our target Brix is raised and we harvest all treatments at that target Brix there is a difference in the wines produced. At a high target Brix the glycoside concentration of the higher crop level grapes in this model never catches up to the low crop vines. This is typical. The spread in glycoside concentration and resultant wine quality is greater the longer the grapes hang on the vine, all other factors being equal.
Figure 3
From these studies a few generalizations can be made for a particular cultivar:
1. The time to reach a targeted Brix value is positively correlated to yield. In other words, the greater the yield the longer the time it takes to reach a certain degrees Brix.
2. Total glycoside concentration is positively correlated with Brix and wine quality at high degrees Brix values(>20.5).
3. Over the wide range of sugar concentrations, phenol-free glycoside concentration is positively correlated with Brix and wine quality.
4. Total and Phenol-free glycoside concentrations and wine quality seem to be negatively correlated with the time it takes to reach a targeted Brix, notably at Brix values greater than 20.5.
Given the above, why can't we simply provide growers with some formulae recommendation regarding yield and quality? It is not simply yield that influences ripening. Ripening is also influenced by a host of other factors including solar exposure of the fruit.
For example, Figure 4 shows the relationship between degrees Brix and phenol-free glycoside concentration of two Cabernet Sauvignon crop levels where fruit zone leaf removal also was imposed. Again, the phenol-free glycosides subtract the influence of color and other phenols.
The data depicted in Figure 4 follows a predicted pattern. The highest concentration of phenol-free glycosides was found in the low cropped, leaf-pulled vines followed by the low crop non-leaf pull. In this study, the glycoside concentration was influenced by both crop level and leaf removal. The differences among crop level treatments becomes greater at higher Brix values. At relatively low degrees Brix concentrations the differences in phenol-free glycosides were minimal as were the differences in wine quality. As we move to the right on Figure 4 (increase our targeted Brix) the differences in glycosides and wine quality become much greater.
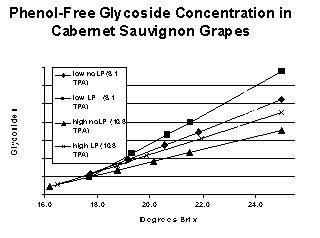
Figure 4
We have observed differences in wine quality even when there are no apparent differences in the rate of fruit maturity as measured by degrees Brix. Table 5 shows only the significantly different grape parameter data of Cabernet Sauvignon fruit grown on a divided canopy at two crop levels and harvested at one date. There was no statistically significant difference in Brix, yet slight differences in fruit chemistry.
Table 6 shows the chemistry of wines produced. TANT represents total anthocyanins. As can be noted, there were slight differences in the alcohol concentration (and therefore, slight differences in Brix values) which could have provided a confounding influence. Both the total and phenol-free glycoside concentrations were influenced either by crop level treatment and/or by the very minor differences in the degrees Brix of the fruit. Sensory analysis of this wine demonstrated perceptible differences among the wines. These data indicate the importance of adequate maturity evaluation and the relationship to wine quality.
Table 5. Significantly Different Grape Parameters for 1999 Cabernet Sauvigon
Harvest at 20.5 Brix on 10/21
| L (7.4 TPA) | H (10.4 TPA) | |
| Berry wt (g) | 1.51 | 1.39 |
| pH | 3.81 | 3.7 |
| Total Gly/g | 2.85 | 2.68 |
| Red Free Gly/g | 0.25 | 0.13 |
| Phenol Free Gly/g | 0.17 | 0.10 |
All data significantly different at P0.05.
Table 6. 1999 Cabernet Sauvignon Wine Data
| L (7.4 TPA) | H (10.4 TPA) | |
| % Alcohol (v/v) | 11.6 | 11.5 |
| TPHE (AU) | 29.4 | 24.1 |
| TANT (mg/L) | 429 | 408 |
| Total Gly (uM) | 1310 | 1097 |
| Red Free Gly (uM) | 449 | 325 |
| Phenol Free Gly (uM) | 201 | 206 |
The relationships between yield and quality are complex due to the factors listed in Table 1. There may be no exact point when overcropping begins. The issue of crop level and wine quality for now comes down to a question of vine balance, balance of yield and vegetative growth and balance of economic considerations. Naturally, from a winery view there is no benefit to having twice the fruit at half the quality. Growers must work carefully with wineries to assure that the interests of both parties are considered and to help the Virginia grape and wine industry maximize it's full and complete potential.
I would like to express our appreciation to the Virginia Winegrowers Advisory Board for their support of this on-going research effort.
II. Web Site
Past issues of the Vintner's Corner as well as current topics, research abstracts, list of extension publications and up coming events are posted on the Enology-Grape Chemistry Group web site at www.fst.vt.edu/zoecklein.
III. Vintner's E-mail Communications
This season I have been e-mailing brief discussions relating to processing considerations. These mailings go to all current Virginia wine producers and prospective producers. If you are not on this mailing list, mail me your e-mail address and you will be added. There is no fee.