
 VINTNER'S CORNER
Vol.16, No. 1 January - February, 2001
Bruce W. Zoecklein
Department of Food Science and Technology
VPI & SU - 0418
Blacksburg, VA 24061,
E-mail:
www.fst.vt.edu/zoecklein/index.html
Table of Contents
| I. Grape Sampling and Maturity Evaluation for Growers | 1 |
|
|
1 |
|
|
3 |
|
|
5 |
| II. Change in Laboratory Services | 6 |
I. Grape Sampling and Maturity Evaluation for Growers
Fruit sampling and maturity evaluations are important factors influencing Virginia wine quality. Maturity evaluations should be viewed with the same focus and intensity that we use in determining when to bottle. The timing of grape harvest determines the maximum wine quality potential thereafter.
High quality wine is the result of the confluence of important fruit attributes. Those attributes include fruit-derived aroma/flavor components and the reduction of immature tannins (and the production of mature tannins). In the ideal world these coincide with a desirable sugar concentration. Unfortunately, grape maturity indexes seldom looks as good as Figure 1. If they did, maturity evaluations would be an easy task. One would simply determine the Brix value and pick at some point along the time line.
Growers must understand that potential wine quality is largely dependent not on primary metabolites such as sugar, but on so-called secondary plant metabolites such as aroma/flavor and phenolic compounds. Grape-derived aroma/flavor and phenolic compounds are the principle source of wine aroma, flavor, color and taste. As such, they are the most important fruit attributes contributing to wine quality and should be considered as a part of any grape maturity evaluation program.
Figure 1. Grape Maturation
Regardless of what maturity gauges are used, an important and universal concern is accurate vineyard sampling. Nothing is more heterogenous than grapes from the same vineyard at a given moment even from the same variety. How do you know if your sampling is representative of what is actually in the vineyard? Each season I hear complaints regarding the difference between a grower's reported Brix values and what the winery noted when they processed the fruit. The difference can be as much as 2 degrees Brix, always with the winery's value lower than that reported by the grower. This variance between the grower's analysis and the true value has a significant and negative impact on wine quality.
We have two basic choices in grape sampling: cluster sampling or berry sampling. With cluster sampling we have a further choice of gathering clusters from throughout the vineyard or using one or more targeted vines. Some vines always develop more quickly than others. Therefore, it is risky to determine the harvest date based on a single vine. From the vast number of studies conducted we know that the variance between the sample analysis and the true vineyard analysis, regardless of the analyte, is smallest if we take a minium number of berries from a large number of vines.
Table 1 provides information on the number of clusters and berries needed to obtain specific levels of accuracy. Guidelines regarding sampling procedures are provided in Table 2. It should be noted that there is a general tendency to select the most mature berries. If you examine a cluster prior to berry sampling you are most likely to pick berries which are more mature. Therefore, berry sampling should involve locating the fruit zone and then sampling without examining the clusters or berries.
Table 1. Grape Sampling
The three factors which have a major role in maturation dynamics are heat, light and soil moisture. Therefore, variation of these within a vineyard block can result in significant sample variation. About 90% of the variation in berry sampling is believed to come from variation in the position of the cluster on the vine and the degree of sun exposure. The vineyard must be sampled based on the degree of fruit exposure.
Table 2. Berry Sampling
- Avoid edge rows and the first two vines in a row
- Collect samples from both sides of the vine
- For each row, estimate the proportion of shaded bunches and sample accordingly
- Collect berries from the top, middle and bottom of the cluster
- Randomize the side of the cluster sampled
- Maximum sample area should be less than 2 hA
Source: Rankine et al., 1962; Jordan and Croser, 1983
The problem of representative sampling is compounded by asynchronous berry, cluster or vine development. A crop with asynchronous berries, for example, has a mixture of development stages resulting in a proportion of berries with optimal qualities diluted by berries which are inferior. Figure 2 illustrates a frequency distribution, berry numbers plotted against Brix. We tend to assume that two vineyards or vineyard blocks with the same or similar Brix values will give similar wines. This can be far from the truth, even before differences arise from processing. If a winery reports a Brix of 22, the juice might be composed of a narrow distribution of a few berries at 20 and a few at 24 Brix with the majority nearer to 22. However, there may be a much wider distribution with berries below 18 and greater than 24. Because Brix is a distribution average, juices with similar Brix values can produce wines which are quite different due to variations in aroma/flavor and phenol content. The importance of asynchronous development is often overlooked and is a major factor limiting the quality potential of some wines.
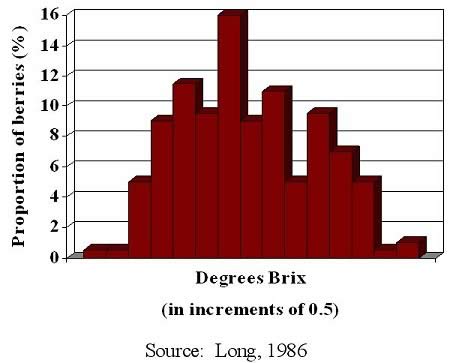
Figure 2. Sugar concentration of individual berries in a 400-berry sample of Cabernet Sauvignon
An additional example of the effect of asynchronous berry development on the aroma/flavor profile is shown in Figure 3, adapted from Coombe and Iland (2). The result is that a proportion of berries with optimal qualities being are diluted by those berries which are inferior.
Figure 3. Effect of Asynchronous Berry Development on Grape Aroma
The figure illustrates that while berries are all harvested at once, their optimum aroma matures at different times. Vines that produce the best quality wines are those with less variability. For an excellent discussion on the subject of asynchronous development, see Long (6). The lower the vineyard uniformity the greater the negative influence on wine quality and the greater the sample volume needed to help get an accurate assessment of maturity.
An evaluation of fruit maturity should be based upon an understanding of the importance of secondary metabolites to wine quality and should involve the following:
This list is in the relative order of importance. It is important to view maturity evaluation in the context of stylistic goals. If the fruit does not contain varietal aroma/flavor character, this character will not be evident in the wine. If the fruit does not contain mature tannins, the wine will not have mature tannins. It is that simple.
Degrees Brix is a universally accepted maturity gauge due, in part, to the fact that it is easy to analyze. In cold to cool regions Brix can be strongly correlated to wine quality. In warm regions such as Virginia this correlation is much less robust. There are several important reasons why Brix and wine quality are not always correlated. Figure 4 illustrates one reason. This figure shows the relationship between berry weight and degrees Brix at several sampling dates. As maturation continues berry weight increases and then begins to decline. This decline frequently occurs prior to harvest. At the point in time where the weight and Brix reading intersect, the Brix can be increasing either due to the production of sugar by the plant or due to dehydration. Brix is defined as grams/100 grams of solution. With the lose of water there is an increase in Brix which represents dehydration, not a physiological change.
Figure 4. Chardonnay
It is important to note that the physiological mechanism the plant uses to make berry sugar is not the same as used to produce secondary metabolites such as aroma/flavor and phenolic compounds. Therefore, there is no reason to assume that Brix equals desirable aroma/flavor of phenols and that we would get a maturity picture like Figure 1. As was noted this last season, we can have low Brix and a high concentration of varietal aroma/flavor or the opposite.
It is common to view grape berries as homogeneous entities, but they are not. As Figure 5 demonstrates, there are three distinctive juice zones which have different components.
Because of concentration gradients within the fruit, it is essential that growers and vintners standardize fruit sample processing. Without such standardization it is impossible to compare results.
As fruit maturity increases there is an increase in varietal character. For example, Cabernet Sauvignon grapes may go through a progression of aromas which could be described as: green, underripe to lightly herbaceous, to herbaceous, to minty-black current, to blackberry. It is important to note that if the winemaker is looking for a certain varietal expression in the wine such as black current, it must be in the fruit. Should growers evaluate juice aroma? Because of the relationship between juice aroma and wine varietal aroma, the answer is yes. Such an evaluation involves one of the most sophisticated instruments known to man, your nose. While requiring some practice, this evaluation is within the capability of all growers. The sample preparation procedure is provided in Appendix 1. Growers can easily monitor changes in the varietal expression by processing fruit, conducting a simple sensory evaluation and freezing the juice. At the next sampling date a new set of berries is processed, evaluated and compared with the thawed sample from the previous date.
Grape phenols include many compounds with different chemical and sensory properties. Grape phenols have a significant influence on wine structure including volume or body, tannin intensity, astringency, bitterness and dryness. As fruit and wines mature, their phenolic compounds bind together or polymerize. This polymerization, along with binding to other molecules such as sugar and proteins, causes a sensory change from 'hard' and bitter to astringent and finally to soft and supple.
We generally view grape berries as homogeneous entities. However, if we examine the phenols of a grape berry we note that there are different types located in different parts of the fruit. Not surprising is the fact that the different parts of the grape ripen at different rates and are thus mature at different times. For example, Figure 6 shows a red berry and the maturity dates of the important components-skin pulp, seeds and cap stem. Given that all parts enter the fermenter in red wine production, the wine quality may be negatively influenced if they are not all physiologically mature.
Figure 6. Fruit Maturities
Figure 7 shows the relationship between skin and seed tannins of Virginia-grown Cabernet Sauvignon at three sampling intervals. With increased fruit maturity there is a change in the gelatin index of the skin phenols which corresponds to an increase in the phenol maturity or polymerization. This is an example of an important qualitative change occurring with fruit maturation. The skin tannin polymerization parallels a sensory transformation, an evolution from hard and astringent to dusty to soft and supple. It should be noted that the change in phenol polymerization depicted in Figure 7 represents a limited change in oBrix (21-22 oBrix from the first to the last sampling). Polymerized skin tannins have a large molecular weight and are smoother on the palate than smaller low molecular weight tannins which are considered to be hard and astringent.
In the east it is not uncommon for winemakers to process red grapes with immature seed tannins. The resulting wines are harsh and hard. As indicated in Figure 7, seed tannin astringency changes little with time. What does change is the extractability of these compounds into the wine. During fruit maturation, seeds mature at a different rate than that of degrees Brix. As seeds mature they change color from green to brown to dark brown. This color change represents oxidative reactions and corresponds to the degree of extractable tannins. As indicated in Figure 8, tannin extractablity decreases during phase 2 and 3 of berry development.In conventional red wine production, seed tannins make up over 60% of the total tannin concentration. It should be noted that changes in tannin maturity can occur late season when it would appear that no additional ripening can transpire.
Figure 7. Changes in Phenol Polymerization (gelatin index) With Grape Maturity
Figure 8. Changes in Seed Tannin Extractability
Evaluations of red fruit maturity should include the assessment of seed and cell wall maturity or berry softness. Berry softness may be an important feature influencing extraction of phenols during red wine fermentation. Tannin maturity of red grapes should be evaluated seriously as described by Zoecklein et al. (10).
Appendix 1. Sensory Evaluation as a Maturity Index Adapted from Zoecklein et al. (1995)
Method 1. Maturity and vineyard management practices can influence the pool of free aroma components. Most of the aroma components are located in the skins. The following is a procedure used to evaluate red grape aroma:
1. Approximately 200 berries are lightly crushed and pressed in a hand press.
2. The skins are separated from the pulp and seeds and placed in approximately 200 ml of 10-15% ethanol adjusted to pH 3.0 with tartaric acid.
3. The skins and alcohol are placed in an airtight jar for several days. The alcohol solution is decanted and evaluated.
Smelling the solution will provide an indication of the odor and odor intensity. Red grapes should have an odor of fruit, cherries, etc. along with "notes" of pomace or tea from the tannins. If there is little varietal aroma or aroma intensity in the grape, these two features will be deficient in the resultant wine.
Method 2. In a non-alcoholic medium juice aroma evaluation must be done with care. Rapid enzymatic oxidation can occur if berries are warm or exposed to air. For example, oxidation produces aldehydes as the result of enzymatic oxidative cleavage of linoleic and linolenic acids to hexenal. These aldehydes can produce grassy aromas that mask fruit characteristics and make aroma assessment very difficult. The procedure suggested by Jordan and Croser (1983) is as follows:
1. Use a cone-in-cone juicer, a potato ricer, a hand press etc. to press the chilled grape sample (<2C).
2. Estimate the quantity of juice that the sample will yield beforehand and add pectinolytic enzyme at the supplier's recommended level. Then add 50 mg/L ascorbic acid and 30mg/L sulfur dioxide. Ascorbic acid or vitamin C is an antioxidizing agent which along with sulfur dioxide will help minimize degradation of aroma components.3. If possible, lightly sparge the juice sample with nitrogen and sieve into sample bottles which have been CO2 filled, seal and cold settle at 2C or less.
4. Decant the clear juice into CO2 filled bottles and carry out both chemical analysis and aroma/flavor evaluations. Note that the sample preparation method, pressing, degree of pressing vs. crushing and cold settling affects the titratable acidity and pH (see Zoecklein et al., 1995). Under optimum conditions, juices prepared using this methodology and stored at 0C will remain viable for aroma/ flavor assessment for several months.
Grape Phenol Maturity Evaluation. Mature tannins in the fruit are a requirement for premium red wines and therefore, are an important harvest consideration. With advances in maturity, phenolic compounds in the skins increase and those of the seeds slightly decrease. While these changes are important, it is qualitative, not quantitative factors that are most significant regarding grape phenols. If fruit is harvested with immature, unpolymerized tannins, the resulting wine will be harsh and hard.A simple strategy for tannin evaluation of grapes is provided: A random and representative sample of fruit is collected and the skins are carefully removed from the pulp. The skins are sensorially evaluated for the presence or absence of hard, astringent tannins. It is imperative that the pulp be removed due to the confounding influence the decline in malic acid has on
the perception of astringency. A portion of these skins is frozen and used as a reference for the evaluation of grapes at the next sample period. Tannins evoke a tactile response rather than a taste; therefore, evaluation is of the texture of the astringency. The textural changes which occur with time are perceived as softening resulting in enhanced suppleness or smoothness. The following is a list of descriptors which can be used to categorize grape tannin astringency: hard, course, green, firm, chewy, dusty, supple, soft, fine and silky. Naturally, these terms are the same as those applied to wines. One can conceptualize tannin evolution as undergoing changes analogous to the textural differences between wool, linen and silk. For a more supple style, more silk-like grape tannins are required. If you are not evaluating tannin maturity, premium red wine quality and control of wine style is a matter of pure luck.
II. Change in Laboratory Services
Laboratory Services. As noted in the previous edition of Enology Notes, demands on the Enology-Grape Chemistry Group's no-charge extension laboratory service have increased dramatically. In the year just ending, we conducted 1632 separate analyses for the Virginia wine industry. The costs associated with the analysis services is in excess of $18,000 annually, not including labor. We simply do not have the resources to sustain this effort while offering extension programs and conducting research.
Each bonded winery in the state should be able to conduct alcohol, pH, TA and sulfur dioxide in-house. These are basic assays that should be part of each and every winery's HACCP plan. The ability to perform these tests is simply a part of being in the commercial wine industry. Any Virginia bonded winery that would like assistance in establishing a lab and/or in conducting these tests can contact my office.
As of January 15, 2001, the laboratory will not conduct analysis on alcohol, pH, TA and sulfur dioxide, unless a winery is having a problem. The laboratory service will remain in effect to provide supplemental quality control analysis, to help in trouble-shooting problems and to provide sensory evaluations. For example, we will continue to conduct HPLC analysis for organic acids, run electrical conductivity tests for bitartrate stability and nepholometric analysis for protein stability.
References
Abbott, N.A., B.G. Coombe, and P.J. Williams. The flavour of Shiraz as characterized by chemical and sensory analysis. Wine Industry J. Nov. pp 315-19 (1990).
Coombe, B.G. and P.G. Iland. Grape Berry Development. In: Proceeding of the Sixth Australian Wine Industry Technical Conference. T. Lee (Ed.). pp 50-54. Australian Industrial Publishers, Urrbrae, South Australia (1987).
Francis, I.L., M.A. Sefton, and P.J. Williams. The sensory effects of pre- or post-fermentation thermal processing on Chardonnay and Semillon wines. Am. J. Enol. Vitic. 45:243-251 (1994).
Gunata, Y.Z., I. Dugelay, J.C. Sapis, R. Baumes, and C. Bayonove. Role of enzymes in the use of the flavor potential from grape glycosides in winemaking. In: Progress in flavor precursor studies. Proceedings of the International Conference. Schreier, P. and Winter-halter, P. (Eds.) Wurzburg, Germany (1994).
Long, Z.R. Manipulation of grape flavour in the vineyard: California. North Coast region. In: Proceedings of the Sixth Australian Wine Industry Conference, Adelaide. T.H. Lee (Ed.) pp 82-88 (1987).
Long, Z. Developing wine flavor in the vineyard. Practical Winery and Vineyard July/August pp 6-9 (1997).
Ribereau-Gayon, P. and Y. Glories. Phenolics in grapes and wines. In: Proceedings of the Sixth Australian Wine Industry Tehcnical Conference, T. Lee (Ed.). pp 247-256. Adelaide, South Australia, Austr. Ind. Publ. (1986).
Zoecklein, B.W., K.C. Fugelsang, B.H. Gump, and F.S. Nury. Wine Analysis and Production. 621pp. Chapman and Hall, New York (1995).
Zoecklein, B.W., T.K. Wolf, and C. Yoder. Effect of crop level on Cabernet Sauvignon and Chardonnay grape glycosides. In: Proceedings of the Fourth International Symposium on Cool Climate Viticulture and Enology (1997).
Zoecklein, B.W., T.K. Wolf, J.E. Marcy, and Y. Jasinski. Effects of fruit zone leaf removal on glycoconjugates and selected aglycones of White Riesling grapes. For submission to Am. J. Enol. Vitic (1998).
Zoecklein, B.W. Effect of fermentation, aging and aging sur lie on total and phenol-free Riesling (Vitis vinifera L.) glycosides. Submitted, Am. J. Enol. Vitic (1998).